It's very easy to make the produced image click-able with a map. So you can click on a part of QOS tree to see the options and change these options. So you need a page for each element. Until now, the scripts only produces the image. The next step would be to make these picture click-able and produce html output. After that, I need some scripts to change the settings.
I tested with some different cbq setups and it worked very well. But there are so much possibility's that I have to try some more combinations to be sure that all elements are recognized and displayed properly.
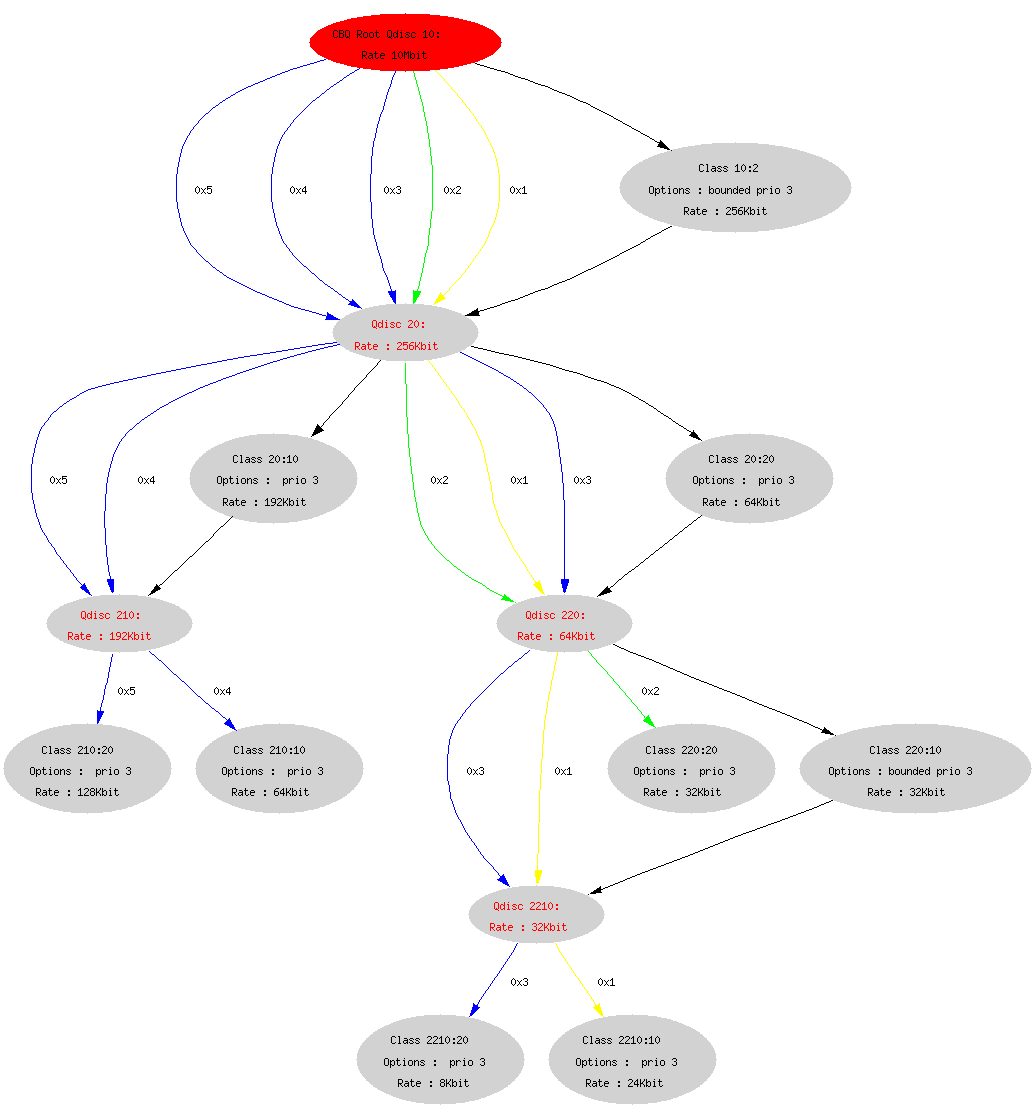
The programs gets a list of the classes and qdiscs. They are processed and the output is generated. For each elements the filters are searched and eventually displayed.
It generates a .dot file and it generates a png with the dot program from this .dot file.
- *.sh: test-scripts
- show.pl: Perl script to show QOS settings
- *.dot: dot-file to create png's